SmartRetail Customer Segmentation for Micro-Targeting
UNDERGRAD GROUP PROJECT

SmartRetail is a data analytics project aimed at revolutionizing customer segmentation in the retail industry. Using machine learning techniques and advanced statistical models, this project analyzes customer data to create distinct segments and uncover hidden patterns. These insights empower businesses to design personalized marketing campaigns, ultimately increasing customer satisfaction and profitability.
The project is based on the Kaggle dataset “Marketing_Campaign,” consisting of 2,240 customer records and 29 features, including demographics, spending patterns, and responses to marketing campaigns. By leveraging tools like K-means clustering, hierarchical clustering, Principal Component Analysis (PCA), and supervised classification models, SmartRetail provides a robust framework for data-driven marketing decisions.
Motivation
The retail sector is characterized by intense competition, with businesses striving to stand out by offering personalized shopping experiences. This project addresses a common challenge: the inadequacy of effective customer segmentation in optimizing marketing efforts. By understanding customer behavior and preferences at a granular level, retailers can allocate resources more effectively and improve customer lifetime value.
Machine Learning Methods and the Results
Clustering Analysis
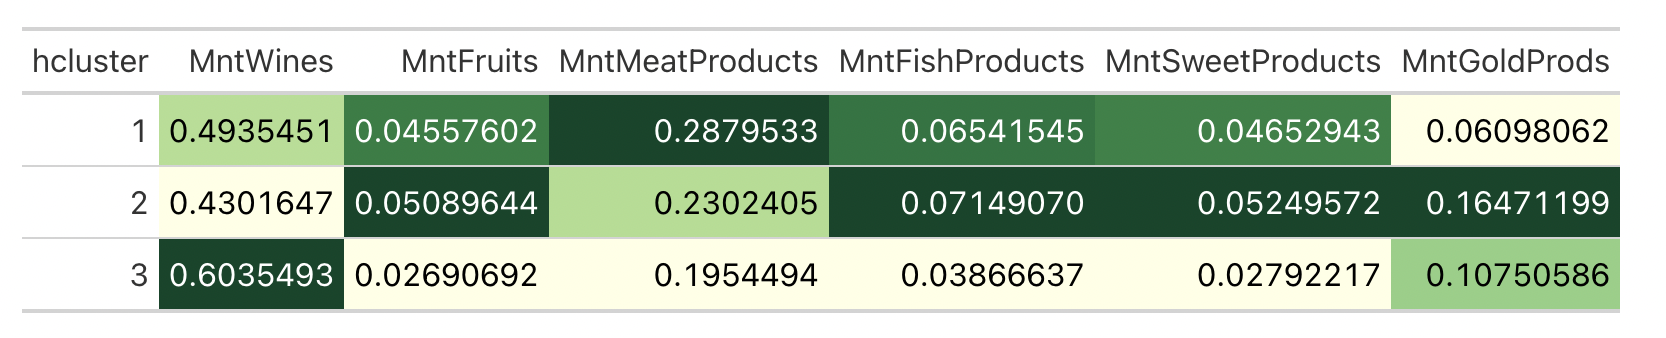
The project segmented customers into three distinct groups using clustering algorithms. Hierarchical clustering with complete linkage was chosen based on the Elbow and Silhouette methods, optimizing the number of clusters at k = 3. The clusters were analyzed as follows:
- Cluster 1: Largest group with 996 customers, characterized by the highest average income ($68,000) and spending. Customers in this cluster spent significantly on meat products and were highly responsive to marketing campaigns.
- Cluster 2: Comprised 894 customers, mostly young adults with bachelor’s degrees, representing the lowest average income ($34,000) and spending. This group was the least responsive to campaigns but showed high deal acceptance rates.
- Cluster 3: Contained 308 customers, with middle-income levels ($49,500) and a preference for wine purchases. This cluster had the highest average number of children and preferred online shopping channels.
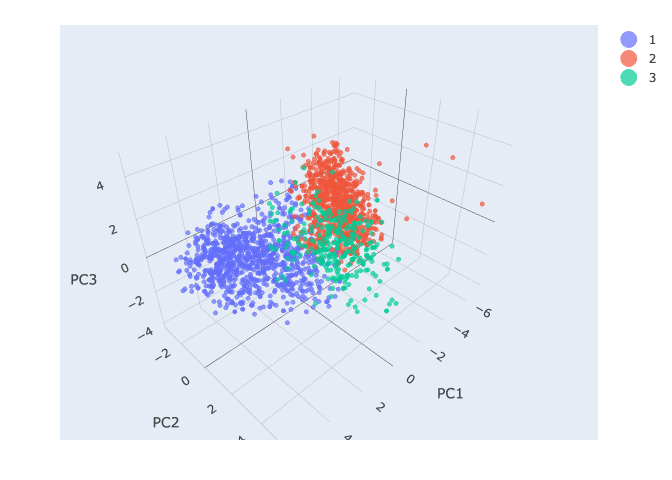
Principal Component Analysis (PCA)
PCA was applied to reduce dimensionality, capturing 58% of data variance with just three principal components. This transformation improved cluster visualization and ensured that customer segments were clearly distinguishable in a 3D space.
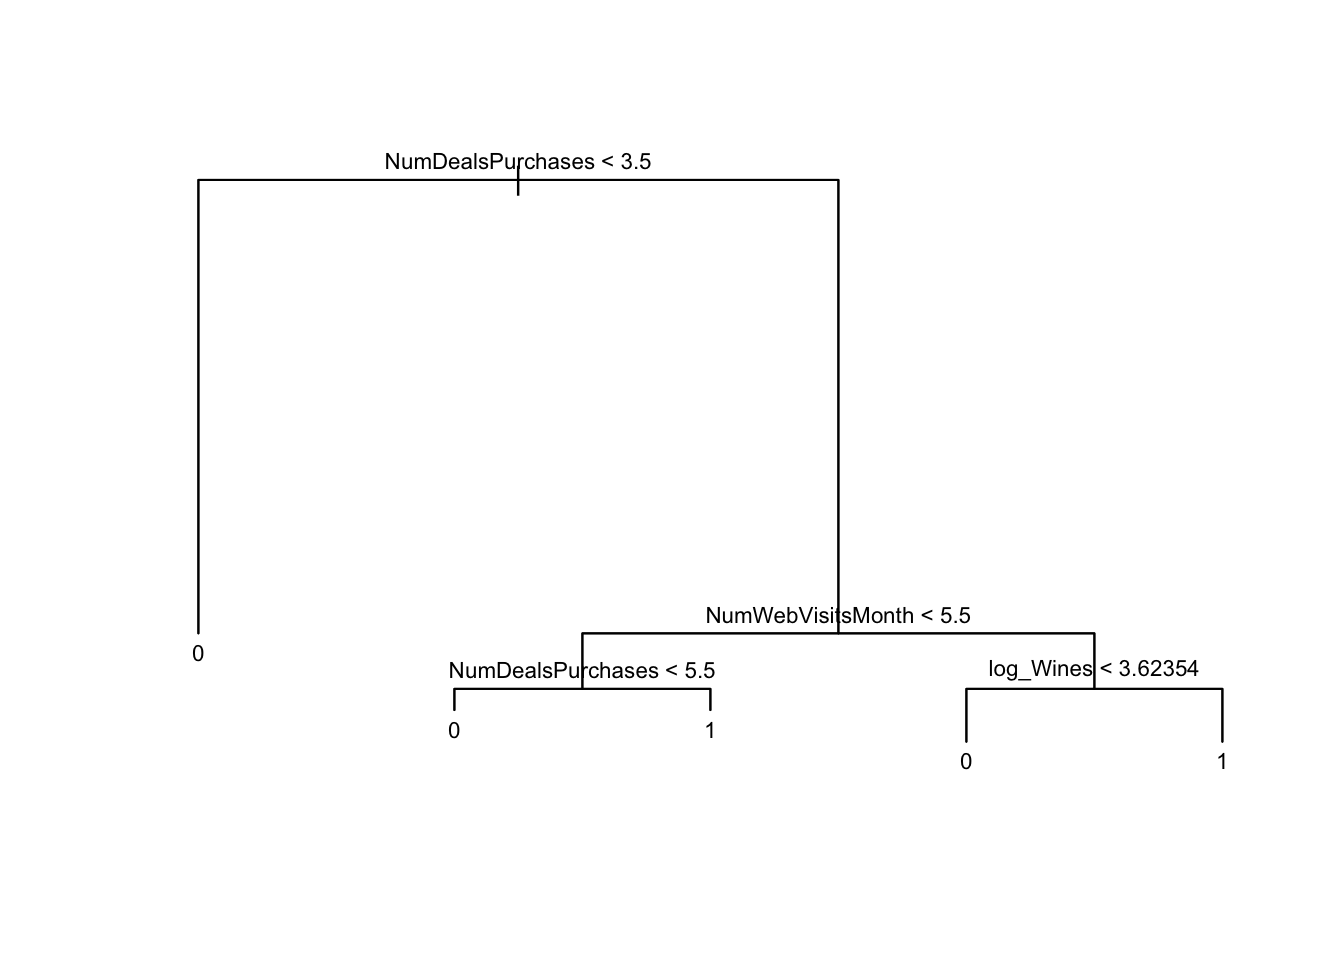
Classification Trees
Classification trees were used to refine the descriptions of customer segments. Key predictors of cluster membership included income, spending behavior, number of children, and campaign response rates. For example:
- Customers in Cluster 1 were identified as high-income individuals less responsive to deals but more likely to accept high-quality product campaigns.
- Cluster 3 members, primarily wine buyers, responded well to personalized offers and family-oriented discounts.
Association Rules
Association rule mining provided insights into customer preferences across sales channels:
- Customers with PhDs or more than 8 years of loyalty showed a preference for web purchases (support: 7.1%, confidence: 32.8%).
- Baby Boomers without children were strongly associated with catalog purchases (support: 6.5%, confidence: 70.1%).
- Families with children were more likely to make high purchases across multiple channels.
Challenges and Reflections
Challenges
- High-dimensional data: Managing and preprocessing 29 features, including numerical and categorical variables, required extensive cleaning and transformation.
- Imbalanced classes: Customer responses to campaigns were heavily skewed, necessitating resampling techniques for logistic regression.
- Ethical data handling: Ensuring customer data privacy through anonymization and secure data practices.
Reflections
- Data transformation enhances results: Log transformations reduced skewness in spending data, improving model accuracy.
- Combining methods provides clarity: The integration of PCA, clustering, and classification offered a holistic understanding of customer behavior.
- Targeted marketing is crucial: Insights into spending habits and campaign responses highlighted the importance of personalized offers.
Conclusion
SmartRetail demonstrates how data-driven insights can transform retail marketing strategies. The project identified three distinct customer segments, each with unique preferences and behaviors:
- Cluster 1: High-income customers favoring premium products.
- Cluster 2: Young, budget-conscious shoppers who respond to deals.
- Cluster 3: Family-oriented, middle-income consumers with a preference for online shopping. By tailoring marketing campaigns to these segments, businesses can improve customer satisfaction, reduce wasteful spending, and achieve higher ROI. Future work could expand geographic coverage, incorporate additional features like lifestyle data, and account for dynamic customer behavior over time.
For further details, refer to the Final Project