Scrollytelling with Quarto Close read Prize (Financial Risk Analysis)
COMPETITION

Scrollytelling stories let you explain complicated concepts to readers as they scroll down the page. You could build up a complicated plot layer-by-layer, zoom in on a famous map, highlight a key quote from an interviewee, or even animate your web graphics.
You can visit my scrollytelling website here: Financial Risk Analysis using the OGARCH model
Abstract
This article attempts a concise financial risk analysis of top semiconductor industry stocks, leveraging unique models such as the multivariate orthogonal GARCH (OGARCH) model, Value-at-Risk (VaR) and volatility metrics, powered by Yahoo finance data. The article also explores critical factors influencing investment decisions, emphasizing the importance of accounting for unseen volatility events. This article provides readers with an understanding of how these fluctuations impact stock performance and understand that volatility is essential for making informed investment choices in this sector.
Brief Description
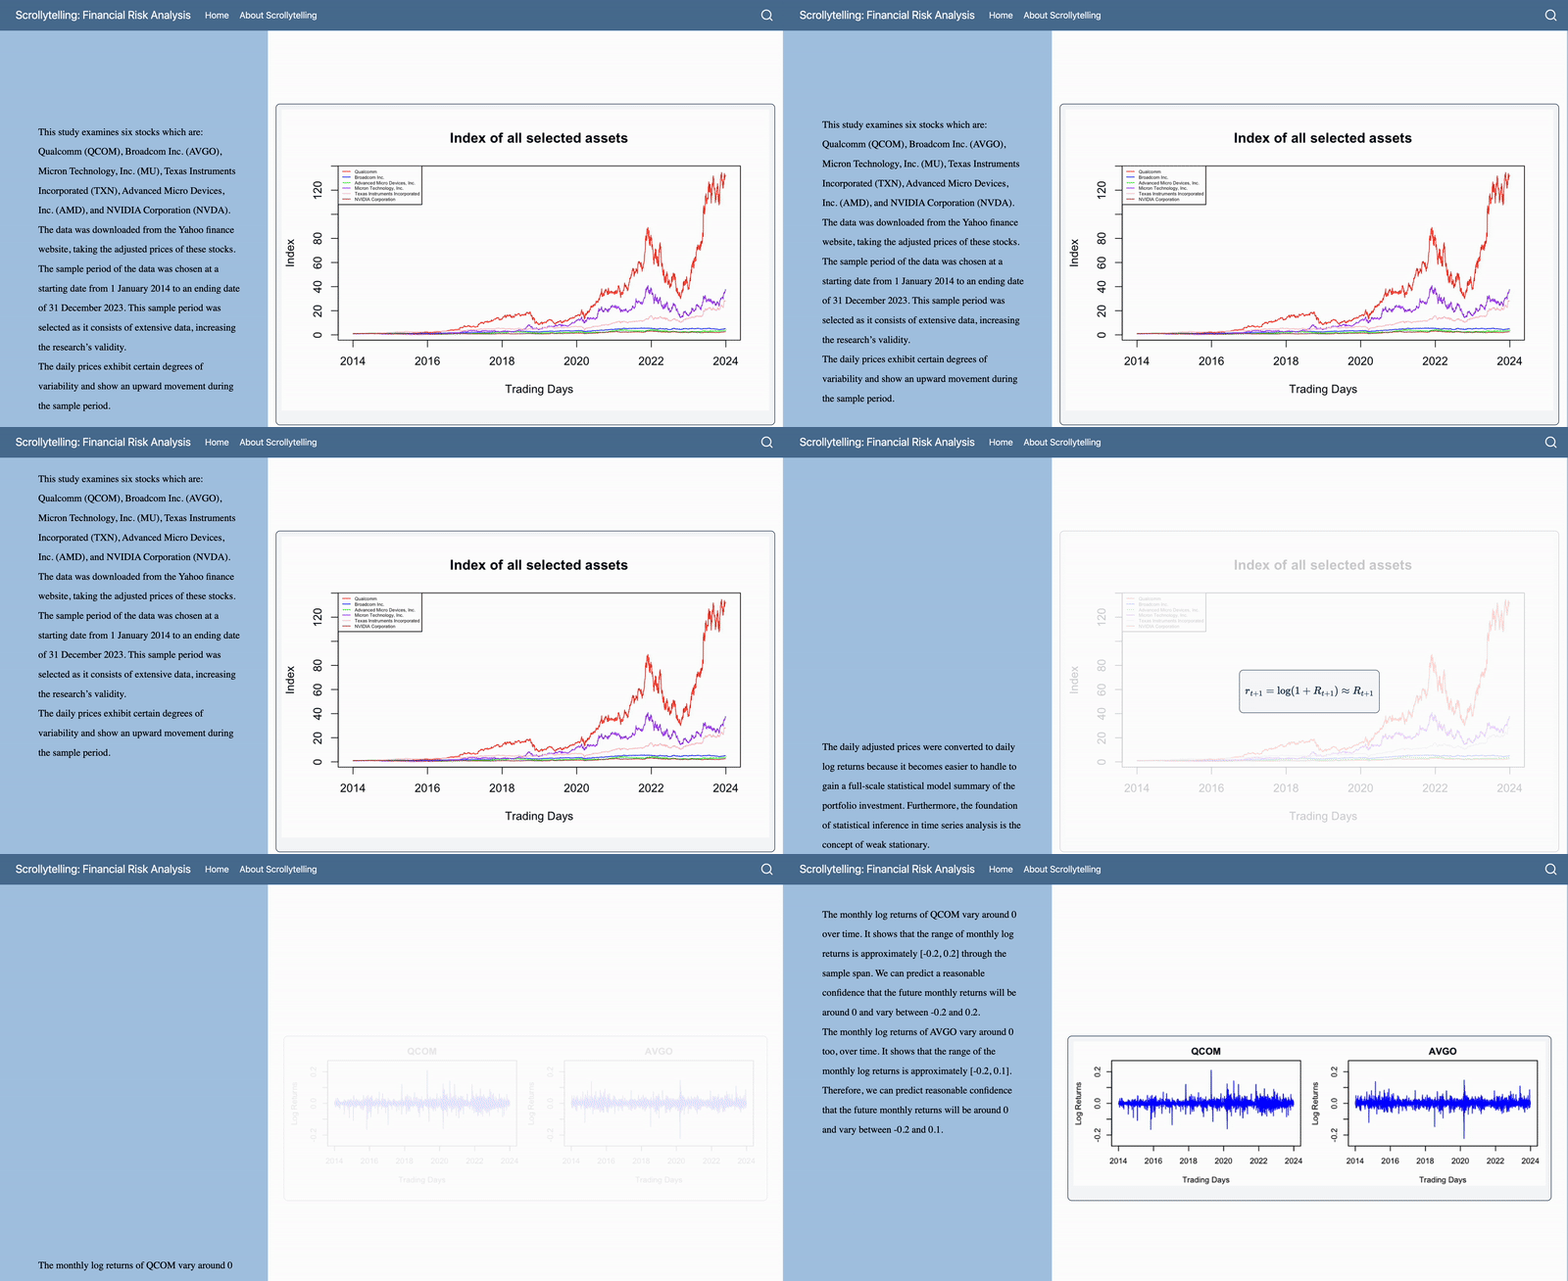
The following stocks are examined in a stock portfolio: Qualcomm (QCOM), Broadcom Inc. (AVGO), Micron Technology, Inc. (MU), Texas Instruments Incorporated (TXN), Advanced Micro Devices, Inc. (AMD), and NVIDIA Corporation (NVDA). The historical daily returns are log-transformed for each stock and analyzed to identify periods of varying volatility sizes during the sampled period (January 1, 2014, to December 31, 2023). The multivariate orthogonal GARCH (O-GARCH) model is applied using principal component factors to identify key drivers affecting these components and compute a conditional variance matrix for each period.
Additionally, a 1% value-at-risk model (VaR) model is calculated to examine the long position of $1 million on the stock portfolio for the next trading day. The reliability of the VaR model is further assessed using a backtesting framework to validate its effectiveness in forecasting risks.
Preview of Scrollytelling

Financial Risk Analysis of Semiconductor Stocks using O-GARCH and Value-at-Risk (VaR) Models
Project Description
This project presents a financial risk analysis of selected semiconductor manufacturing stocks by examining their asset volatility through advanced econometric models. Utilizing R, specifically the O-GARCH (Orthogonal Generalized Autoregressive Conditional Heteroskedasticity) and Value-at-Risk (VaR) models, this study evaluates the risk and volatility of investments within the semiconductor sector. Findings are visually and interactively presented through a custom personal website, built with the qmd-lab/closeread R package, HTML, and CSS.
Disclaimer: This analysis is purely academic and is not intended as financial advice or investment guidance.
Table of Contents
- Motivation
- Problem Statement
- Data Description
- Methodology
- Key Findings
- Features
- Lessons Learned
- Credits
Motivation
Understanding the dynamics of financial volatility is essential for assessing portfolio risk and making informed investment decisions. The semiconductor industry, due to its sensitivity to innovation cycles and global supply chains, presents a compelling case for volatility modeling.
Problem Statement
How can investors assess the volatility and risk associated with semiconductor stocks over time? What models best capture the true underlying risk of these assets, given the fact that volatility is not directly observable?
Data Description
- Stocks Analyzed: Qualcomm (QCOM), Broadcom (AVGO), Micron Technology (MU), Texas Instruments (TXN), Advanced Micro Devices (AMD), NVIDIA (NVDA)
- Source: Yahoo Finance
- Time Period: January 1, 2014 to December 31, 2023
- Data Type: Adjusted closing prices, converted to daily and monthly log returns
Methodology
- Log Returns Calculation: Asset prices were transformed into daily and monthly log returns to allow for consistent volatility modeling.
- Exploratory Analysis: Visual inspection of returns, outliers, and summary statistics.
- Univariate and Multivariate Models:
- ARCH, GARCH for basic volatility estimates
- O-GARCH (1,1) model using principal component analysis (PCA)
- Value-at-Risk Estimation:
- Empirical quantile method
- Parametric O-GARCH model
- Backtesting: Rolling window approach to evaluate model accuracy over time
Key Findings
- Volatility & Return Profiles:
- AMD and NVIDIA show high volatility and extreme returns, often tied to market events like CPU/GPU launches and the AI boom.
- Texas Instruments has the lowest volatility, offering a more stable investment profile.
- Statistical Highlights:
- Highest Avg Return: NVIDIA
- Highest Volatility: AMD
- Most Outliers (High Kurtosis): AMD, Qualcomm
- Negative Skew (Extreme Losses): Broadcom
- Correlation Insights:
- Strong correlations between TXN, AVGO, and QCOM
- AMD and QCOM show lower correlation → better diversification
- O-GARCH Findings:
- 3 Principal Components explain over 85% of return variation
- PC1 = Market Factor
- PC2 = Financial Factor
- PC3 = Emerging Tech/Metaverse
- Value-at-Risk (VaR):
- Estimated VaR at 95% confidence for $1M = ~$25,946 to $44,449
- Backtesting showed good fit in normal times, underperformance in stress periods like COVID-19
Features
- Real stock data from Yahoo Finance
- Time series modeling with ARCH, GARCH, and O-GARCH
- Principal Component Analysis (PCA)
- Rolling window VaR backtesting
- Interactive visuals via Quarto R website
Lessons Learned
- Modeling volatility is crucial but must consider structural shifts in the market
- PCA is powerful in simplifying high-dimensional financial data
- Backtesting is essential to validate the reliability of risk measures
- Market news and innovation cycles significantly affect semiconductor stock performance
Credits
This project was inspired and guided by:
- Financial Risk Forecasting: The Theory and Practice of Forecasting Market Risk with Implementation in R and Matlab by Jon Danielsson
- An Introduction to Analysis of Financial Data with R by Ruey S. Tsay
Website built using qmd-lab/closeread, HTML, and CSS.
Built with R, qmd-lab/closeread, HTML, and CSS. Not financial advice. For academic and demonstration purposes only.
